How to Design Better Metrics.

Metrics are a powerful tool; they help you measure what you care about. Having lofty goals is great, but to know if you’re making progress, incentivize your team, and create accountability, you need to be able to express them in numbers.
But that’s easier said than done. There are dozens of metrics that seemingly measure the same thing, and new trendy metrics are invented every day. Which ones should you use and what should you avoid at all costs?
Over the last decade, I have been living and breathing metrics—especially at Vindy, where tracking the right data made all the difference in how we optimized our platform. I’ve found that there are a few general principles that distinguish good metrics from bad metrics:

Principle 1: A metric should be a good proxy of what you’re trying to measure
You typically cannot directly measure the exact thing you care about.
This is closely related to what people often call the “relevance” of the metric: Does it create value for the business if you improve the metric? If not, then why measure it?
At Vindy, we initially focused on the total number of book searches conducted on our platform. But we quickly realized that this wasn’t necessarily a good measure of success. A high search volume didn’t always mean customers were finding what they needed. Instead, we started tracking how often a campus searched for a title that didn’t have a matching offer. This gave us a much clearer picture of demand gaps and helped us refine our supply strategy.
Principle 2: The metric should be easy to calculate and understand
People love fancy metrics; after all, complex analytics is what you pay the data team for, right? But complicated metrics are dangerous for a few reasons:
-
They are difficult to understand. If you don’t understand exactly how a metric is calculated, you don’t know how to interpret its movements or how to influence it.
-
They force a centralization of analytics, taking away the ability of other teams to do decentralized analysis.
-
They are prone to errors. Complex metrics often require inputs from multiple teams, which increases the likelihood of unnoticed errors.
-
They often involve projections, which can be misleading.
At Vindy, we experimented with a composite customer engagement score that factored in searches, purchases, and time spent on the platform. But after months of back-and-forth discussions and recalculations, we found that simply tracking repeat transaction rates per campus was a far more reliable and actionable measure.
Principle 3: A good (operational) metric should be responsive
If you want to manage the business to a metric on an ongoing basis, it needs to be responsive. If a metric is lagging, i.e., it takes weeks or months for changes to impact the metric, then you will not have a feedback loop that allows you to make continuous improvements.
At Vindy, we specifically tracked how interactions with our core search and checkout features changed as we rolled out UI improvements. This allowed us to quickly see if a tweak to the search algorithm actually made it easier for users to find what they needed, or if we had inadvertently made things more confusing.
Principle 4: A good metric doesn’t have arbitrary thresholds
Many popular metrics are tied to a threshold—but these should be based on actual data, not just round numbers.
At Vindy, we found that customers who transacted over two consecutive busy seasons were 90% more likely to return in subsequent seasons. This became a key retention metric for us, as it helped us identify the campuses that were most engaged and worth focusing our marketing efforts on.
Principle 5: Good metrics create context
Absolute numbers without context are rarely helpful. Turning absolute numbers into ratios or comparisons makes them far more meaningful.
At Vindy, we didn’t just track total book purchases—we measured purchase volume relative to total book searches. This helped us gauge how well our inventory was matching demand, rather than just celebrating raw sales figures.
Principle 6: A metric needs a clear owner who controls the metric
If you want to see movement on a metric, you need to have a person responsible for improving it. Even if multiple teams contribute to moving the metric, a single owner should be accountable.
At Vindy, we ran into issues when both the operations team and the marketing team claimed responsibility for improving transaction rates. The result? A lack of coordination and mixed messaging to our customers. Once we assigned clear ownership to the operations team—with marketing as a supporting role—we saw immediate improvements in strategy execution.
Principle 7: A good metric minimizes noise
A metric is only actionable if you can interpret its movements. To get a clean read, you need to eliminate as many sources of “noise” as possible.
For example, at Vindy, we initially tracked web traffic as a key top-of-funnel metric. But after closer inspection, we realized that a large portion of our traffic was coming from existing customers reordering books—not new leads. By filtering out repeat visitors from our acquisition data, we got a much clearer picture of our actual growth.
Conclusion
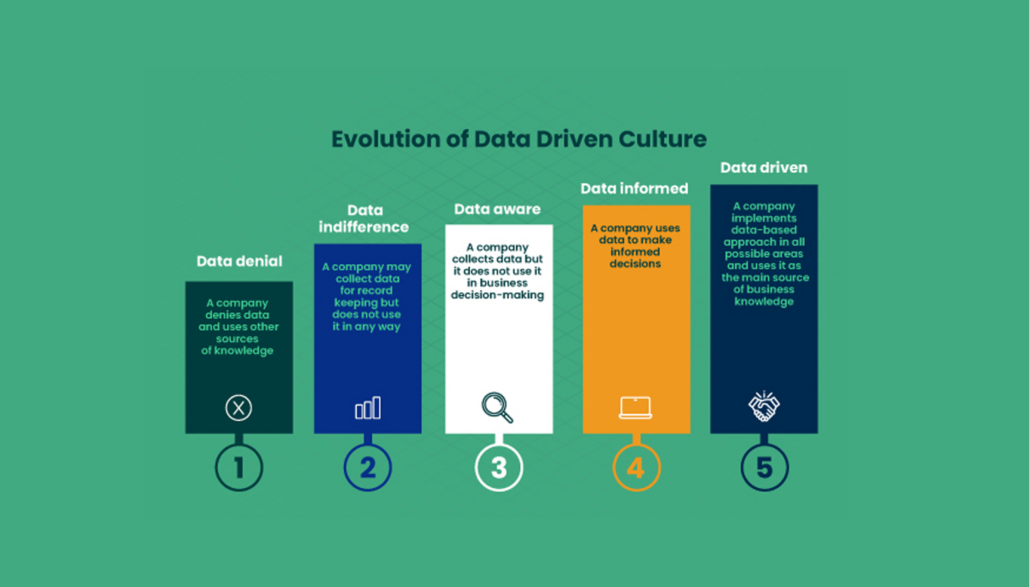
Good metrics are at the core of making data-driven decisions, but they have to be carefully selected. At Vindy, we learned through trial and error which metrics were truly meaningful and which led us down the wrong path. By focusing on responsive, easy-to-understand, and hard-to-game metrics, we were able to optimize our platform and drive real growth. The same principles can help you navigate your own data strategy and make better business decisions.

