MailChimp has been my preferred email marketing vendor for quite some time. They have an outstanding product, easy to use features, and a great company culture.
I recently came across a blog posting from MailChimp talking the importance of analytics within your email system. MailChimp provides an array of very useful data that help marketers dial in their marketing campaigns and programs. Unfortunately, most of the companies I work with either don’t pay attention to the data or don’t know what they’re looking for within it.

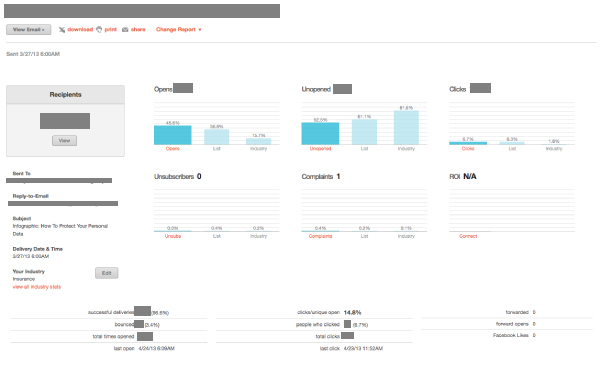
Sample Email Analytics Report
For the companies that are looking at data, they will typically focus and determine a program’s success upon two statistics:
- Open Rate
- Unsubscribes
And while both of the statistics definitely have their merit and can show the company some important information from the campaign, they don’t really tell the entire story of how your marketing campaign was viewed.
Dig a Little Deeper
Within MailChimp’s reports, there are a number of great statistics provided within the email in addition the standard ones mentioned above. I want to share some of those statistics and why they’re important to your company’s marketing efforts.
Highly Engaged Viewers
MailChimp provides a rating system for your subscribers. It’s a basic 5-star rating system where individual’s score increases as they interact with your emails. What’s great about the rating system is that it allows you to actually segment and send material to your most engaged consumers. You can reward people for their loyalty to your marketing campaigns. Within the MailChimp article, a retail clothing line out of Alabama, Billy Reid, actually uses the rating system send out access to private sales and exclusive in-store events.

Sample Viewer Engagement
Click Performance
While it’s important to know who has opened and viewed your emails, it’s much more important to know which content the audience is interacting with. The Click Performance measure shows an overview of all of the links within a given email and the amount of times each link was clicked. This a great way to see what not only what type of content is the most interesting to your subscribers, but also how that content was presented. You might find people like to watch videos more than your written content or that an interesting infographic garners many more clicks than an article. (Ideally, you would actually send out A/B split test emails with the same content presented in different formats to truly understand which medium is best for your audience, but simply monitoring which has the most clicks will at least give you a good idea of what’s working.)

Sample Links Report
Open Time
Watch the open times of your emails very closely. While you may be abiding by the industry studies that say to send your emails early in the morning on a Tuesday or Thursday, your audience might not be opening them up until later that night. If your company sells retail goods, there are a number of times where sending your email at night makes more sense because you will have a better chance to grab the recipient’s attention. They could be watching TV with a tablet in front of them and a simple, eye-catching email will earn a much higher response at that time.
Location Information
If you collect location information with your email sign-up (this could be as simple as a zip-code), then you can monitor where your audience is opening up their emails. For retail companies, this can be especially helpful as it can assist your company with future location decisions. For example, in the MailChimp article, this same retailer saw significant open rates from the Atlanta, GA and Austin, TX, which actually led the company to open a brick-and-mortar location in Austin that summer.


